



Digital Currency Market Cycles and Key Influencing Factors
The cryptocurrency market is known for its high volatility and 24/7 trading characteristics. For investors, understanding its unique market cycles and influencing factors is fundamental to determining buying and selling opportunities. Typically, the crypto market experiences four phases: accumulation, uptrend (bull market), distribution, and downtrend (bear market). Identifying the current phase helps investors formulate corresponding strategies.
- Bitcoin Halving Events: Bitcoin's halving events, occurring approximately every four years, have historically been considered significant catalysts for market cycles. However, recent cycles show new dynamics; for example, before the April 2024 Bitcoin halving, Bitcoin's price had already reached new all-time highs, indicating an evolving market expectation and reaction pattern to the halving.
- Institutional Capital Inflows and Regulation: Increased institutional investment, such as the launch of spot Bitcoin ETFs, and the gradual improvement of regulatory frameworks worldwide (e.g., progress on the US CLARITY Act), have greatly boosted the growth and legitimacy of the cryptocurrency market. These factors bring new liquidity and investor confidence to the market and may also signal new entry opportunities.
- Market Liquidity Dispersion: With the continuous emergence of Layer 1 and Layer 2 solutions, the crypto ecosystem is becoming increasingly complex, and market liquidity is also becoming more dispersed. This makes widespread altcoin rallies, as seen in past cycles, less likely.
- Accelerated Retail Fund Rotation: In the current market environment, retail funds are rotating between new tokens at a significantly faster pace, making it difficult for mainstream altcoins to maintain sustained upward trends. Investors need to identify value and trends more precisely.
Methods for Determining Digital Currency Buying and Selling Opportunities
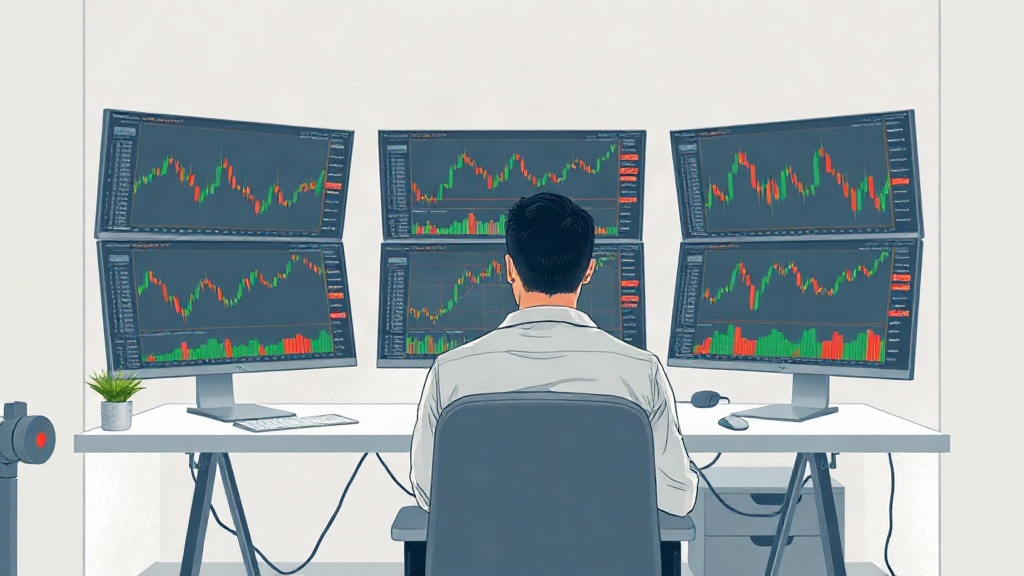
To effectively determine digital currency buying and selling opportunities, investors can utilize a combination of various analytical tools and methods:
Technical Analysis
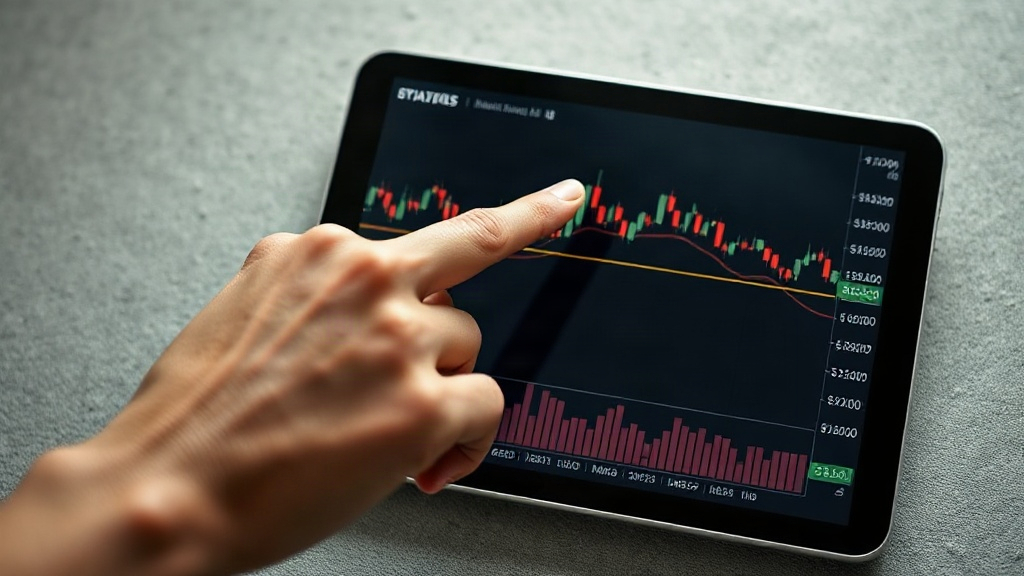
Technical analysis predicts future price movements by studying historical price charts and trading volume data. Commonly used technical indicators include:
- Moving Average (MA): Used to identify trend direction and potential support/resistance levels. A "golden cross," where a short-term MA crosses above a long-term MA, is typically seen as a bullish signal, while a "death cross" (the opposite) is a bearish signal.
- Relative Strength Index (RSI): A momentum oscillator that measures the speed and change of price movements. An RSI below 30 usually indicates an asset is oversold, potentially signaling a buying opportunity; above 70 indicates overbought, potentially signaling a selling opportunity.
- Moving Average Convergence Divergence (MACD): A trend-following momentum indicator. When the MACD line crosses above the signal line, it is generally considered a buy signal; a cross below is a sell signal.
- Bollinger Bands: Uses standard deviation to determine price trends and volatility, useful for identifying overbought/oversold conditions and price ranges.
- Fibonacci Retracement: Based on the Fibonacci sequence, used to identify potential support and resistance levels, helping to predict key points for price pullbacks or rebounds.
- Stochastic Oscillator: Another momentum indicator used to identify overbought and oversold conditions by comparing a closing price to its price range over a given period.
- On-Balance Volume (OBV): A volume-based indicator reflecting buying and selling pressure and potential trend changes. Rising volume with rising prices often signals trend continuation.
- Support and Resistance Levels: Support levels are areas where prices may rebound after falling, while resistance levels are areas where prices may retreat after rising. These are important psychological and technical thresholds on charts.
- Candlestick Charts and Pattern Analysis: By analyzing various candlestick patterns (e.g., triangles, head and shoulders, double tops/bottoms), one can gain insight into market sentiment and potential price reversals or continuations.
Fundamental Analysis
Fundamental analysis focuses on macroeconomic factors and the project itself that influence the intrinsic value of a cryptocurrency. This includes:
- Supply and Demand: The token's supply, issuance mechanism, and market demand are key determinants of price.
- Investor Sentiment: Market sentiment, such as the "Fear & Greed Index," can reflect the prevailing market psychology, helping to judge whether the market is overly optimistic or pessimistic.
- Macroeconomic Trends: Global economic conditions, interest rate policies, inflation, and other macroeconomic factors have a significant impact on the cryptocurrency market.
- Regulatory Policies: The attitudes and policy changes of governments and regulatory bodies towards cryptocurrencies play a decisive role in market legitimacy and future development.
On-Chain Metrics
On-chain metrics provide unique market insights by analyzing public data on the blockchain to assess the health and activity level of a cryptocurrency network:
- Network Value to Transaction (NVT) Ratio: Similar to the price-to-earnings ratio in the stock market, it assesses whether an asset is overvalued or undervalued by comparing network market capitalization to on-chain transaction volume.
- Miner Revenue: The profitability and behavior patterns of miners can reflect market sentiment and potential selling pressure.
- Daily Active Addresses: Growth in the number of active addresses usually indicates increased network usage and user engagement, which is an important indicator of network health.
Strategies for Different Investor Types

Depending on risk tolerance and investment goals, investors can adopt different strategies:
- Long-Term Investors (HODL): These investors tend to buy and hold cryptocurrencies for the long term, disregarding short-term price fluctuations. They typically invest based on in-depth fundamental analysis of a project and belief in its future value.
- Short-Term Traders: This includes day trading, swing trading, and scalping. These traders profit from short-term price fluctuations and require high risk tolerance, market understanding, and trading skills.
- Trend Traders: Buy and sell based on asset momentum, with holding periods that can last several months. They typically combine fundamental and technical indicators to identify and follow market trends.
Market Trading Hours and Risk Warning
The cryptocurrency market operates 24/7, unlike traditional financial markets. However, peak trading activity often aligns with US stock market trading hours (9:30 AM to 4:00 PM ET), while specific assets like Ethereum may also see trading peaks during certain periods (e.g., between 1 PM and 6 PM UTC). Investors can check real-time trading volume data on platforms like Svmuu to gauge market activity.
While the cryptocurrency market offers numerous opportunities, its high volatility also comes with significant risks. Data from the Bank for International Settlements shows that a considerable proportion of Bitcoin retail investors have faced losses. Therefore, trading cryptocurrencies requires a full understanding of market volatility and the use of flexible strategies to mitigate risk, including setting stop-losses, diversifying investments, and only investing funds one can afford to lose.