



The inverse head and shoulders is a classic technical analysis pattern, considered a reversal signal that may indicate a market shift from bearish to bullish. It typically takes a longer time (several months or even more) to form than its bearish counterpart, the head and shoulders top.
What is an Inverse Head and Shoulders Pattern?
The inverse head and shoulders pattern consists of three consecutive lows and two consecutive highs, resembling the outline of a human head and shoulders. Its core components include:
- Left Shoulder: The first rebound low in a downtrend.
- Head: The price falls again, creating a new low lower than the left shoulder, followed by a rebound low, which is the lowest point of the entire pattern.
- Right Shoulder: The price falls for a third time, but the low does not break below the head, and the rebound height is roughly equivalent to the left shoulder.
- Neckline: A straight line connecting the high after the left shoulder's rebound and the high after the head's rebound, typically considered a key resistance line. This line can be horizontal or sloped.

The inverse head and shoulders pattern is officially confirmed only when the price rebounds from the right shoulder and ultimately breaks above the neckline effectively.
How to Identify Key Signals
Identifying an inverse head and shoulders pattern involves not only observing the price contour but also paying attention to changes in trading volume:
- Volume Characteristics: During the formation of the head, trading volume is usually one of the lowest levels in the entire downtrend. However, when the price starts to rebound from the right shoulder, especially when breaking above the neckline, trading volume should significantly increase. This is an important signal to confirm the validity of the breakout. Without a clear increase in volume, the breakout may be a false signal.
- Neckline Role Reversal: Once the price effectively breaks above the neckline, the former resistance line will transform into a support line, and subsequent price pullbacks may find support there.
Trading Strategy Reference
For traders looking to utilize this pattern, the following strategy framework can be referenced:

- Entry Timing: A common entry point is when the price breaks above the neckline with significant volume. After the breakout, the price sometimes pulls back to the neckline (which has now become a support level). If it finds support there and rises again, it can be considered a secondary buying or adding position opportunity.
- Stop-Loss Setting: To manage risk, the stop-loss level is usually set below the low of the right shoulder, or not far below the neckline. The specific position can be adjusted based on personal risk tolerance and price volatility.
- Target Measurement: A commonly used minimum target measurement method is to measure the vertical distance from the lowest point of the head to the neckline, and then project the same distance upwards from the breakout point of the neckline, using this as the potential target price area. This is only a theoretical reference, and the actual price movement may far exceed or fall short of this target.
Historical Cases of Bitcoin
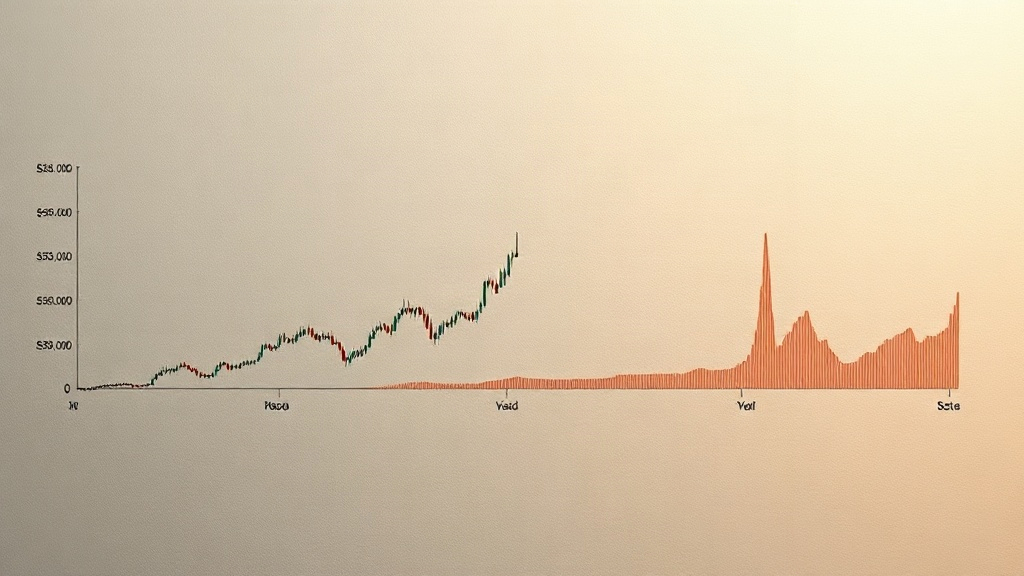
Bitcoin has historically shown multiple suspected inverse head and shoulders pattern structures. For example, in September 2021, after Bitcoin's price fell from approximately $52,000, it formed a composite structure similar to an inverse head and shoulders in the approximately $39,000 area, after which the price broke upwards and initiated a new rally. Looking back at the trend in the first half of 2018, there was also an inverse head and shoulders pattern identified by technical analysts, which foreshadowed a subsequent rebound.
It is important to emphasize that these cases are merely historical pattern examples and not predictions of future price movements.
Notes and Limitations
Although the inverse head and shoulders is considered one of the more reliable reversal patterns, it is not perfect in practice, especially in highly volatile cryptocurrency markets.
- Pattern Failure Possible: The price may fake a breakout above the neckline and then fall back, leading to pattern failure.
- Requires Combined Analysis: One should not rely solely on a single pattern for decision-making. Combining other technical indicators such as trend lines, moving averages, Relative Strength Index (RSI), as well as macro market cycles and on-chain data for comprehensive analysis, can improve the accuracy of judgments.
- Risk Management Priority: Any trading strategy based on technical patterns must include strict risk management, such as setting stop-losses.
Technical analysis is a tool designed to help interpret market sentiment and potential supply and demand changes, but it cannot guarantee future price movements. Investors should fully understand its limitations and make decisions based on their own risk tolerance.