


Bitcoin Current Price and Market Cap Metrics
Public market snapshots show Bitcoin (BTC) price fluctuating around $77,500 to $78,000, with a 24-hour change of approximately 0.3% to 1.4%. Based on a price of approximately $78,000 and a circulating supply of about 20.11 million coins, the circulating market cap is estimated to be in the range of $1.56 trillion to $1.57 trillion.
Data snapshots, statistical methodologies, and covered trading pairs vary across different market platforms, which may lead to minor discrepancies in price, market cap, and trading volume. When reviewing charts, prioritize confirming data from the same time point and supply methodology.

- 24-hour trading volume: Approximately $12.27 billion to $14.33 billion.
- Market dominance: Bitcoin's market cap accounts for approximately 60.4% of the total cryptocurrency market cap.
- Circulating supply: Approximately 20.11 million coins, nearing the 21 million coin cap.
Recent Price Trends
Based on public market data, Bitcoin's recent price has shown a retracement: a decline of approximately 3% to 4.5% over the past week, about 7.34% over the past month, and approximately 29% over the past year. These changes reflect price performance over different periods and do not equate to future trends.
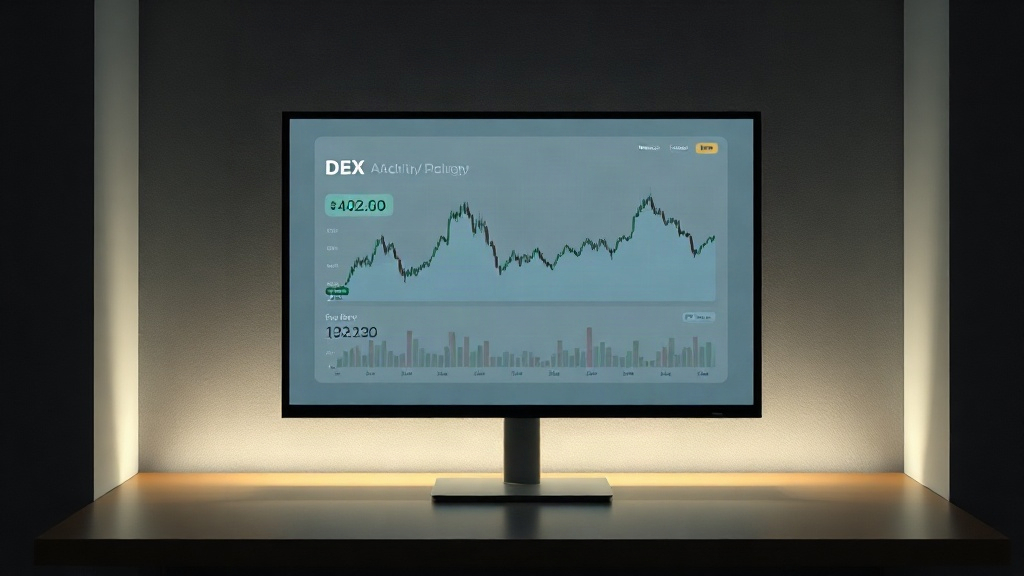
Price charts typically include elements such as candlesticks, trading volume, moving averages, support, and resistance. Short-term charts tend to amplify volatility, while longer-term charts better reflect trends driven by supply, halving, and macroeconomic capital shifts.
Supply Cap and Halving Mechanism
Bitcoin's protocol rules limit the total supply to 21 million coins and reduce the rate of new issuance through halving events that occur approximately every four years. On April 19, 2024, Bitcoin completed its halving, reducing the block reward from 6.25 BTC to 3.125 BTC.

Halving does not directly determine price, but it alters miner revenue, the pace of new coin issuance, and the circulating supply curve. As the circulating supply approaches its cap, Bitcoin's scarcity narrative is more often used to explain its positioning as a store of value asset.
All-Time High and "Digital Gold" Narrative
Historically, Bitcoin reached a high of approximately $126,000 in early October 2025. Compared to the recent price range of approximately $78,000, the price at that time was significantly higher. The all-time high illustrates Bitcoin's significant price volatility and reminds readers not to extrapolate single-period performance into long-term trends.

"Digital gold" is one of Bitcoin's common market narratives, centered on fixed supply, decentralized issuance, and verifiable rules. This narrative is relevant to institutional adoption and asset allocation discussions but does not guarantee price performance.
How to Understand "Latest Price Trend Chart"
When looking at a Bitcoin price trend chart, you can first distinguish three things: price level, trading activity, and cycle position.
- Price level: The distance between the current quote and the all-time high.
- Trading activity: Whether the 24-hour trading volume supports price changes.
- Cycle position: Whether weekly, monthly, and yearly lines are moving in the same direction.
Under public data metrics, Bitcoin's current price is around $77,500 to $78,000, with weekly and monthly lines showing weakness, and the yearly line also showing a significant retracement. Different platforms may provide different values, and readers should compare data from the same source and time point.