



Capital flows are not a single figure
Analyzing cryptocurrency capital flows essentially involves interpreting the data by considering the public on-chain ledger, exchange reserves, stablecoin issuance and redemptions, derivatives positions, and sector rotation collectively.Focusing on a single metric can be misleading: a large transfer might simply be an internal movement between an exchange’s cold wallets; net outflows from an exchange could stem from market makers replenishing their reserves, or they could result from users withdrawing coins for long-term holding.
Start by examining three layers: overall market liquidity, exchange reserves, and wallet behavior
Capital flows can be broken down into three layers, from macro to micro. First, examine whether there is new capital entering the market as a whole; next, determine whether that capital remains in tradable venues; and finally, observe the specific activities of individual addresses.
- Market-wide liquidity: Changes in the total market capitalization or supply of stablecoins are often seen as clues indicating new capital inflows or redemptions. If the stablecoin supply continues to increase, it may signal that off-exchange funds are preparing to enter the market; if it drops rapidly, it may correspond to redemptions, payment settlements, or a decline in risk appetite.It is important to distinguish between issuance, redemptions, cross-chain transfers, and changes in reserve assets.
- Exchange Inventories: Capital flowing from private wallets into exchanges is often interpreted as an increase in tradable assets and rising short-term selling pressure; outflows from exchanges to private wallets are frequently seen as a sign of hoarding or increased willingness for long-term holding.Crypto educational content on platforms such as Binance Plaza and Gate Academy often employs this framework, but actual signals must be analyzed in conjunction with exchange type, spot vs. derivatives markets, OTC transactions, and platform inventory metrics.
- Address Behavior: Active addresses, transaction volume, large-value transfers, wallet clustering, and entity tagging. On-chain analytics firms such as Glassnode, Nansen, and Arkham Intelligence often use clustering to identify groups of addresses controlled by the same entity or large holders, and track changes in the holdings of so-called “smart money.”
How to Interpret Exchange Net Inflows and Outflows More Reliably
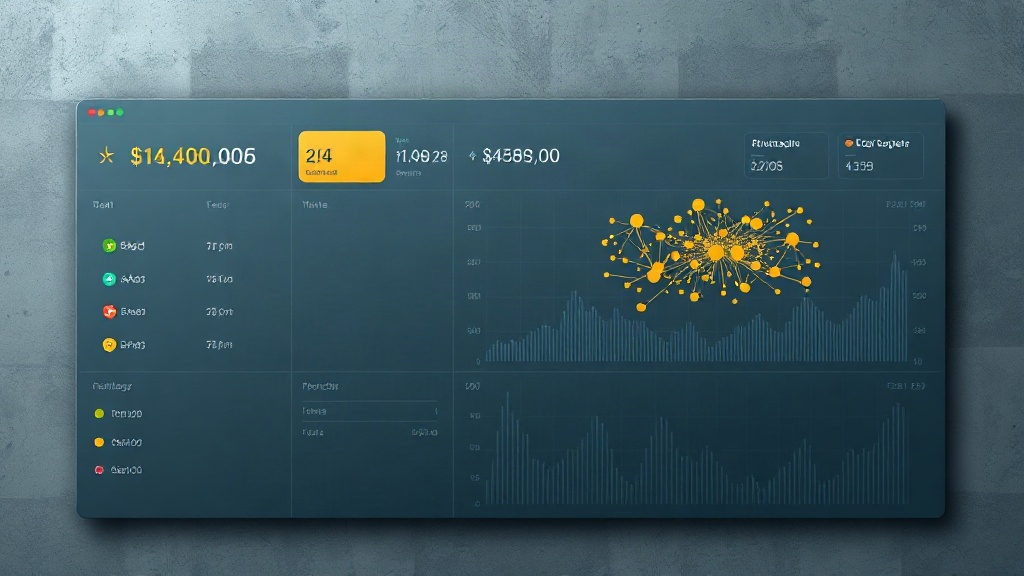
Exchange inflows and outflows are not simply “good” or “bad.” A more reliable approach is to first examine trends rather than momentary spikes, then look at net changes before assessing the individual sizes of inflows and outflows, and finally break down the data into spot trading, derivatives, stablecoins, and major cryptocurrencies.

- Short-term spikes: A large inflow may result from custodial transfers, market maker reallocations, or internal exchange settlements, and does not necessarily indicate market selling pressure.
- Sustained Trends: Net outflows from an exchange over multiple consecutive days or weeks are a stronger indicator of shifting holding patterns than a single anomalous movement.
- Currency Breakdown: The implications of inflows for BTC, ETH, and stablecoins differ. Stablecoin inflows into an exchange may indicate preparation for a purchase or payment settlement; inflows of major cryptocurrencies, however, are more closely associated with potential selling pressure.
- Market Structure: The interpretive weight of the same flow indicator varies depending on whether the market is in a bull run, bear market, sideways trend, or experiencing event-driven shocks.
Changes in Total Stablecoin Market Capitalization: A Leading Indicator of Liquidity
Stablecoins serve as a medium of exchange, a unit of account, and a safe-haven asset in the crypto market. Changes in total stablecoin market capitalization are significant because they reflect whether the pool of funds readily available for trading is expanding or contracting.
However, a rise in total stablecoin market capitalization does not necessarily mean an immediate buy signal, nor does a decline necessarily mean an immediate sell signal. Issuance, redemptions, cross-chain bridge transfers, changes in reserve assets, and regulatory disclosures can all influence the readings.To analyze stablecoin capital flows, it is best to simultaneously monitor stablecoin balances on exchanges, the frequency of on-chain stablecoin transfers, issuance and redemption records for major stablecoins, and reserve information disclosed by regulators or issuers.
Large Transfers and “Smart Money”: Don’t Confuse Transfers with Trading
Large-value transfers are the most obvious—and also the most easily misinterpreted—signal among on-chain capital flows.A large transfer that significantly deviates from typical daily volumes may correspond to a variety of activities: transfers from exchange cold wallets, inventory reallocations by market makers, transfers by custodians on behalf of clients, cross-chain bridge routing, arbitrage or MEV-related transfers, or even position-building by a new address.
On-chain analytics firms commonly use wallet clustering, entity tagging, and “smart money” tracking to filter out noise. “Smart money” typically refers to groups of addresses historically observed to enter positions early, hold large positions, or exhibit stable trading patterns. However, tags may be outdated, mislabeled, or intentionally changed by institutions, so the movements of “smart money” should not be treated as definitive buy or sell signals.
Sector Rotation: Where Capital Flows From and To
Capital flows are also evident across different sectors. Changes in the dominance of major cryptocurrencies, the relative strength of altcoins, and the locked-in value or trading volume in sectors such as DeFi, NFTs, and GameFi can help gauge risk appetite.Capital flowing out of BTC and ETH into higher-volatility sectors typically indicates rising risk appetite; capital flowing back from high-risk sectors into stablecoins or major cryptocurrencies typically indicates a stronger tendency toward risk aversion.
Sector data changes over time, and statistical methodologies may vary across different platforms. When reviewing TVL, trading volume, or sector rankings, pay attention to the time window, whether data is deduplicated, whether cross-chain assets are included, and whether the data has been verified.
Derivatives and ETF Capital Flows: Capital Beyond Spot Markets
Crypto capital flows are not limited to spot chains. Open interest in futures contracts, funding rates, liquidation amounts, options positions, and ETF subscriptions and redemptions all influence price trajectories.Capital may first express market sentiment through derivatives before trickling down to the spot market; alternatively, it may be forced to liquidate during margin calls, creating a chain reaction that appears as an outflow from the spot market.
Tools such as CoinGlass are commonly used to view derivatives capital flows, liquidations, and position distributions. ETF capital flows, on the other hand, rely more heavily on disclosures from issuers, exchange trading data, and custodial records. Only by combining on-chain spot flows with derivatives and ETF flows can we get closer to a complete picture of capital flows.
How Common Tools Divide Roles
- Glassnode: Often used to view historical time series of on-chain metrics, exchange balances, active addresses, and more.
- Nansen: Commonly used for address tagging, wallet clustering, and tracking “smart money.”
- Arkham Intelligence: Often used for entity tagging, capital maps, and relationships between institutional or project addresses.
- Dune Analytics: Ideal for monitoring capital flows across protocols, bridges, and sectors via custom dashboards.
- CoinGlass: Commonly used for market structure data such as derivatives capital flows, liquidations, and funding rates.
Data definitions may vary across platforms, and the same metric may yield different values. A more reliable approach is to cross-verify data from multiple sources rather than relying on a single dashboard for conclusions.
A Practical Observation Process
- First, select a time frame: intraday for price spikes, weekly for trends, and monthly for cycles.
- Examine stablecoin supply and exchange stablecoin balances to determine whether liquidity pools are expanding.
- Examine net inflows and outflows on exchanges, breaking them down by BTC, ETH, and stablecoins.
- Examine large-value transfers and active addresses to determine whether activity represents internal transfers or genuine trading.
- Examine derivatives positions, funding rates, and liquidations to confirm whether spot and futures markets are moving in the same direction.
- Examine sector rotation and dominance to gauge shifts in risk appetite.
- Finally, revisit news, regulatory developments, and macroeconomic events to avoid mistaking correlation for causation.
Common Misconceptions
- Assuming that inflows into an exchange directly equate to an imminent market sell-off.
- Equating outflows from exchanges with a long-term bullish outlook.
- Ignoring the accounting treatment of stablecoin issuance, redemptions, and cross-chain transfers.
- Relying solely on data from a single platform without cross-validating across time frames and metrics.
- Overemphasizing the “smart money” label while ignoring the possibility of lag or mislabeling.