Classification of Virtual Asset Platforms and Market Data Software and Their Representative Tools
In the digital asset market, due to the decentralized nature of assets and global trading, data is typically dispersed across different exchanges and Layer-1 blockchains. To efficiently track market trends, analyze the market, and execute asset allocation, users generally rely on various desktop tools. Based on their core functions, these tools can be divided into three main categories: professional charting and technical analysis, comprehensive market data tracking, and market data and trading terminals built into centralized exchanges (CEX).
In the field of professional charting and technical analysis, representative tools include TradingView and AICoin. Such software does not directly serve as a venue for asset custody or order matching; instead, it focuses on providing robust data aggregation, multi-timeframe candlestick charts, and a rich set of technical indicators. They typically support web browsers or standalone desktop clients to meet the demands of deep technical analysts.
In terms of comprehensive market data and market capitalization tracking, representative tools include CoinMarketCap and CoinGecko. Primarily used for macro research, they provide global cryptocurrency market cap rankings, 24-hour trading volume, exchange listings, and basic project background information, serving as essential windows for users to understand the overall market ecosystem on desktop devices.
Regarding market data and trading terminals integrated within centralized exchanges, representative platforms include Binance, OKX, and Gate.io. These platforms not only offer web versions but have also developed dedicated desktop clients, combining real-time market quotes, order book depth charts, funding rate monitoring, and spot and derivatives trading functions.
Core Functions and Applicable Scenarios of Various Tools
Different types of market monitoring and trading tools possess distinct architectures and functional advantages, making them suitable for different use cases and user groups.
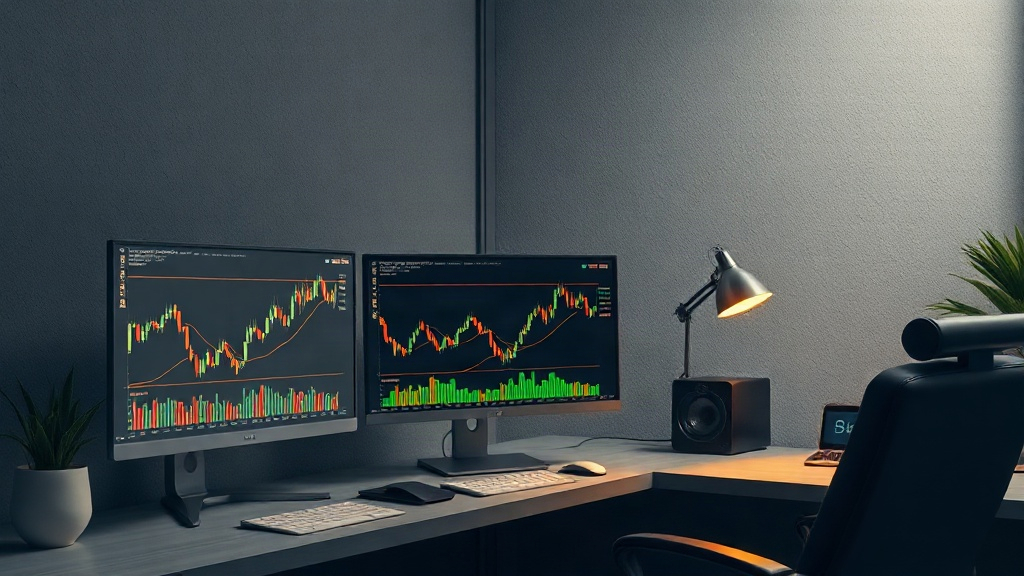
Professional charting and analysis software such as TradingView derives its core advantage from powerful chart rendering capabilities and cross-device cloud synchronization. It supports thousands of custom technical indicators, multi-chart split screens, and custom script writing, and is frequently used by various traders as a universal charting workspace. AICoin leans toward the aggregation of data from multiple mainstream exchanges, offering features like chip distribution, real-time depth charts, and custom indicator alerts, making it exceptionally well-suited for technical analysts with frequent market-watching needs.
Comprehensive market capitalization tracking websites are well-suited for macroeconomic data research. When users need to understand a token's circulating supply, all-time high price, smart contract address, or sector, such tools provide a rapid, bird's-eye perspective.
Desktop terminals of centralized exchanges are tailored for users who need to directly engage in asset allocation, spot trading, or risk hedging. Taking Binance, OKX, and Gate.io as examples, these platforms typically disclose 100% Proof of Reserves audit data on a regular basis and adopt multi-layered account security protection measures (such as server security authentication and ISO security standards), delivering real-time market depth and order book data while safeguarding funds and trading execution efficiency.
Limitations of Tool Selection and Potential Risk Warnings
Although the aforementioned tools provide significant convenience to market participants, users must still remain mindful of their inherent limitations and potential risks during actual operations.
First, relying solely on a single exchange or market monitoring tool may introduce blind spots in data. For instance, observing the price action of only one exchange may fail to reflect the consolidated liquidity of the global market, and could even lead to misjudgments caused by localized market anomalies; furthermore, a lack of a cross-platform arbitrage perspective may cause traders to miss out on price differential opportunities across different markets.
Second, the core essence of various market data software and monitoring tools is data display and market analysis; they do not possess the capability to predict future price trends. Technical indicators and historical charts merely reflect past trading trajectories and cannot eliminate the risks of high volatility inherent in the market. When conducting any asset allocation, users should combine multi-dimensional information to make rational assessments, avoiding over-reliance on a single tool or indicator.