

Faster global financial news!
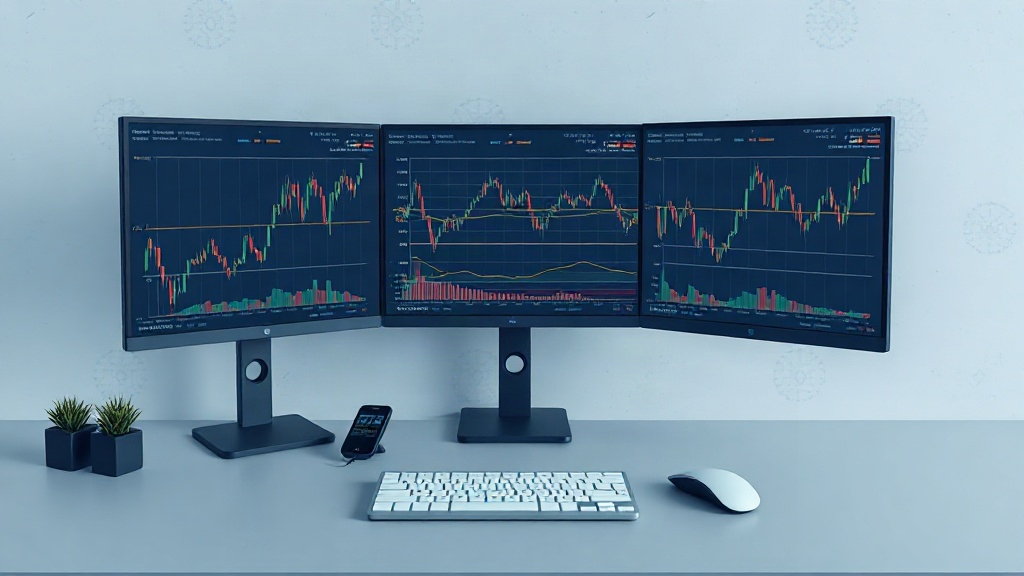
Analysis: Single stock implied volatility significantly surpasses S&P 500 ETF, spread hits new high since 2016, historical data suggests SPY options may be undervalued


Analysis indicates that over the past ten weeks, the average implied volatility (IV) of individual stocks has remained at a historical high of approximately 50%, while the average implied volatility of the S&P 500 ETF (SPY) has been relatively low, at around 13.5%. The spread between the two has approached 36%, reaching its highest level since 2016. Historical data shows that under such extreme divergence, SPY options (especially call options and straddles) are typically undervalued and exhibit positive returns, while individual stock options generally underperform.
No AI analysis yet. Tap the "AI Analysis" button above to generate one now.
Disclaimer: This content reflects the author's personal views only and does not constitute investment advice.


24H Trending
-
1
Lombard (BARD) Token Analysis: Value, Investment Potential, and Risk Assessment
-
2
SKL (SKALE): Ethereum Scaling, AI Agent Deployment, and Governance Dynamics Analysis

-
3
A Rundown of Major Global Crypto Exchanges and Fee Comparison: How to Choose a Low-Cost Platform?
-
4
WSI Token: Role and Future Outlook of the WeSendit Decentralized File Sharing Platform

-
5
What is the price of XRP in RMB? Latest market trends and recent developments

-
6
The Digital Currency Era: Fintech's Opportunities and Challenges Coexist

-
7
EPICHERO Token: Current Status and Future Outlook of the 3D NFT Gaming Project

-
8
Ethereum Foundation: The Behind-the-Scenes Supporter and Growth Driver of the Ethereum Ecosystem

-
9
NEBL Coin Analysis: Positioning, Mechanics, and Market Status of the Neblio Platform Token

-
10
How to Buy Shiba Inu (SHIB): Exchange Platforms and Step-by-Step Guide

Markets Today




Recommended Reading

Hot Topics

Svmuu focuses on blockchain industry trends and cutting-edge cryptocurrency news, while also covering real-time market data and in-depth analysis of the Hong Kong, U.S., and foreign exchange markets. Here, you can not only access professional 24/7 news updates and accurate market data, but also utilize practical investment tools to help you capitalize on opportunities in both digital assets and traditional financial markets. Whether you are a blockchain enthusiast or an investor in Hong Kong, U.S., or foreign exchange markets, we provide efficient and timely information services to empower your investment decisions.
- User Agreement
- Privacy Policy
- Contact Us
- Business Partnerships
- Disclaimer
- Content Statement
- About Us
- Sitemap
 Coming Soon!